Structuring visual narratives to feed the curiosity
Presented for World Information Architecture Day’s Delhi Chapter, this post is a transcript of a talk focused on using different journalistic frameworks to structure stories. The theme for the 2021 edition of the World IA Day was curiosity, so the talk focused on creating narratives in a way that fed the reader’s curiosity. If you’d rather watch me speak on the topic, here is the video:
When Souvik first reached out to me to speak at World IA Day, he introduced me to the concept of Information Architecture. Prior to that, I had no idea of what the term meant. After all, I have two degrees in journalism and none in design or computer science.
I started reading up on the field and found this definition somewhere on the internet.
"Information architecture (IA) focuses on organising and structuring content in an effective and sustainable way."
Two words stuck out to me.
"Information architecture (IA) focuses on organising and structuring content in an effective and sustainable way."
Stories have a structure too! And there are several formulas/frameworks to these structures in news. And journalists have all these creative and fun terms for them. There are many many many frameworks, but here are a handful.
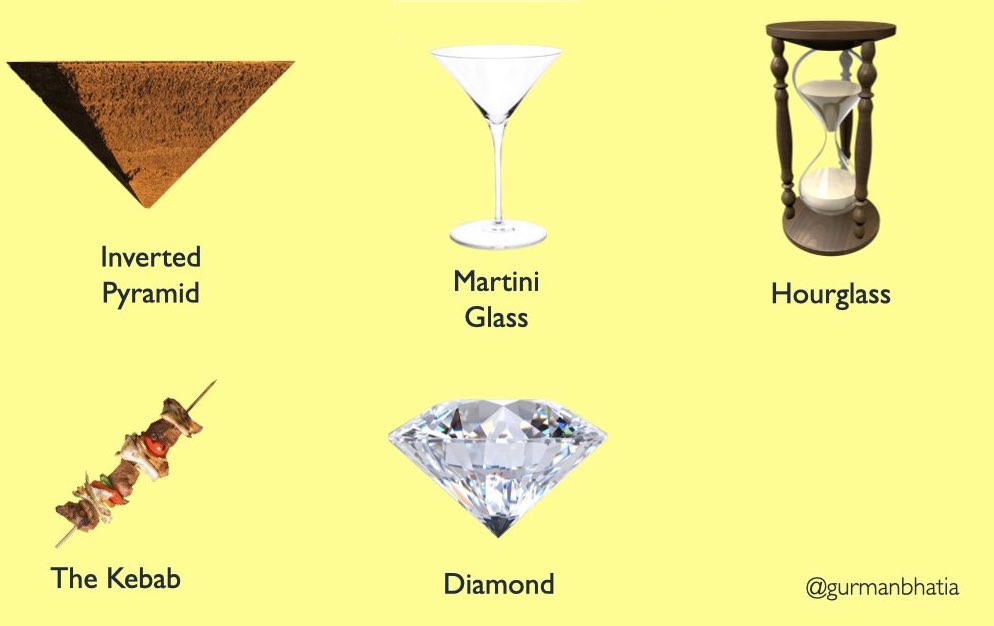
Over the years, I have noticed ways of incorporating these in visual and interactive stories. Since visual narratives on the web are about design and the story working in tandem, different structures can be used to create different kind of experiences for the reader.
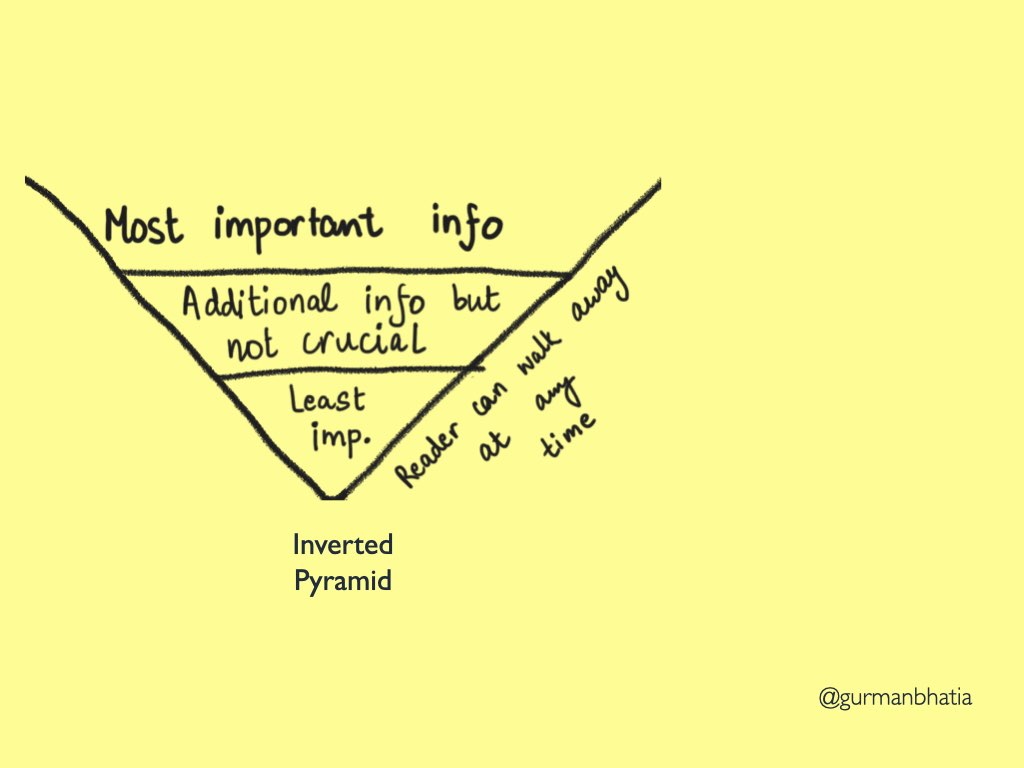
The Inverted Pyramid
The inverted pyramid is a format used frequently in the news. The stories on the front page of a newspaper are most likely to follow this structure. It starts with the most important information on the top and as you move further in the story, the priority of the information decreases. With this structure, the reader can move away from the story at any point in time.
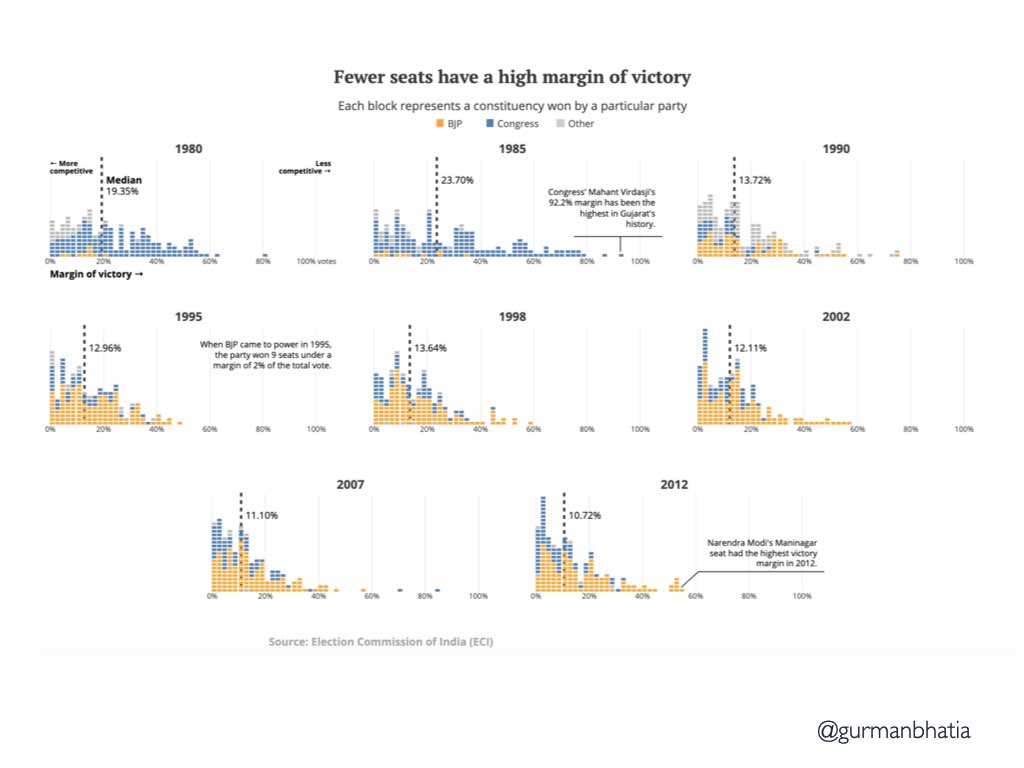
For this story about the Gujarat elections that I did at the Hindustan Times, the page starts with a headline and a visual that tells me what the story is about.
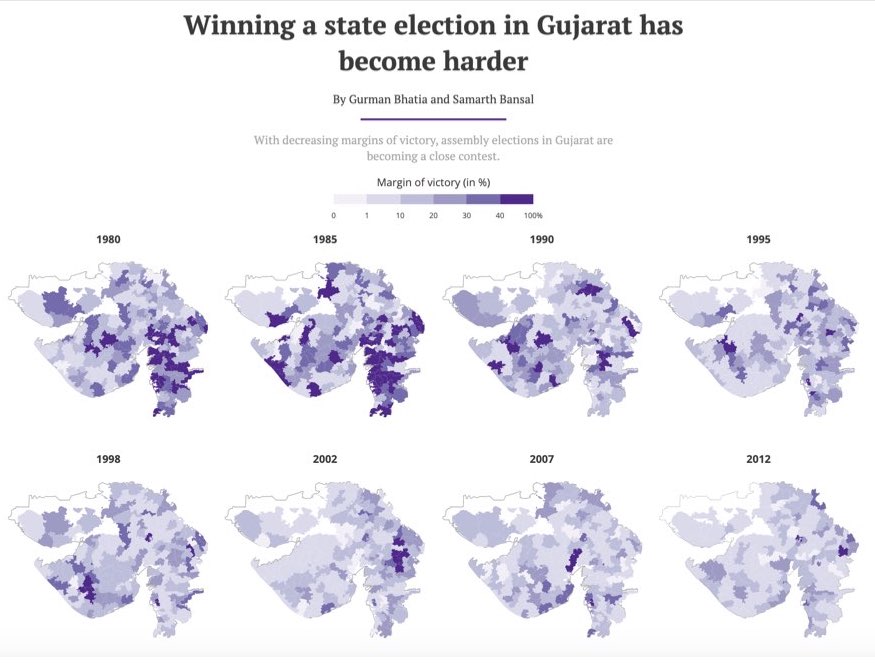
That is followed by a nutgraph (a paragraph outlaying the crux of the story) and key information illustrating that fact.
Elections in Gujarat have become more competitive over the last sixty years, as indicated by a narrowing of the winners’ margins of victory, a Hindustan Times analysis of Gujarat election data shows.
The median margin of victory — that is, the difference between the votes received by the winner and the runner-up as a proportion of total valid votes polled — was 22.2% in 1962. In 1995, when the BJP first came to power in the state, the figure reduced by half to around 12.96%. In 2012, it further slipped by two percentage points to 10.72%.
Every other element dives deeper and gives additional information. Here is the distribution in a histogram.
Then some quotes from candidates…
Further, eight seats in 2012 had a winning margin of less than 1% of the final vote. Of the eight, the Congress won six; the BJP and the NCP got one each.
One such seat was Kalol in the Gandhinagar district, where the Congress's Baldevji Thakor beat the BJP's Atulbhai Patel by just 343 votes. In 2007, Patel won the Kalol seat while Thakor won from another constituency—Kadi. This year, both names will appear on the ballot for Kalol again.
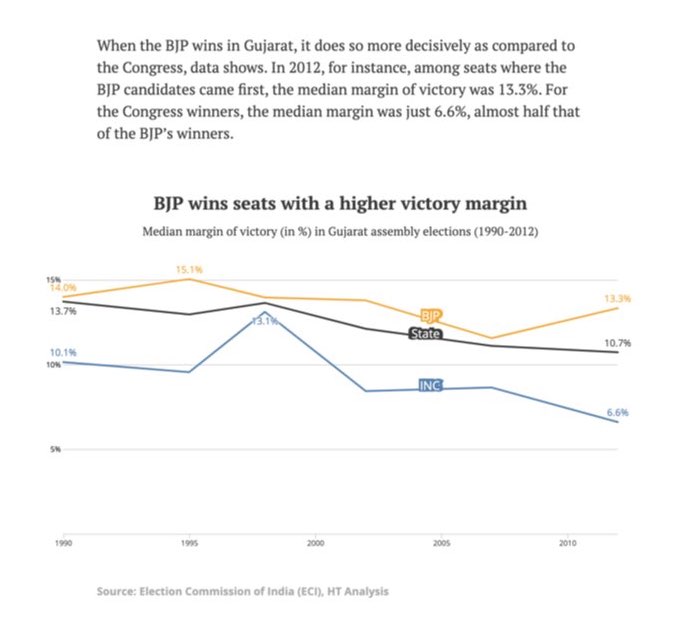
And party trends…
Ending with specific examples of seats that have had consistently high or low margins.
Two constituencies near Ahmedabad, Ellis Bridge and Naroda, and two near Surat, Chorasi and Surat City West, have been strongholds of the BJP for the last two decades. In all elections since 1995, these four are the only seats where the margin of victory has been among the top 20 victory margins statewide.
...
“These are seats in the Hindu heartland,” Jani said. These seats represent the “typical upper-caste Baniya areas” — comprising of the urban business class BJP supporters, she added.
In the Dehgam constituency, the fight has consistently been tough since 1995. The BJP won the seat in 1995 and 1998, but since then, the Congress took over. The last election from this seat was won by the Congress’s Kaminiben Rathore with a margin of just 1.8%.
The Martini Glass
Time to pour some drinks…
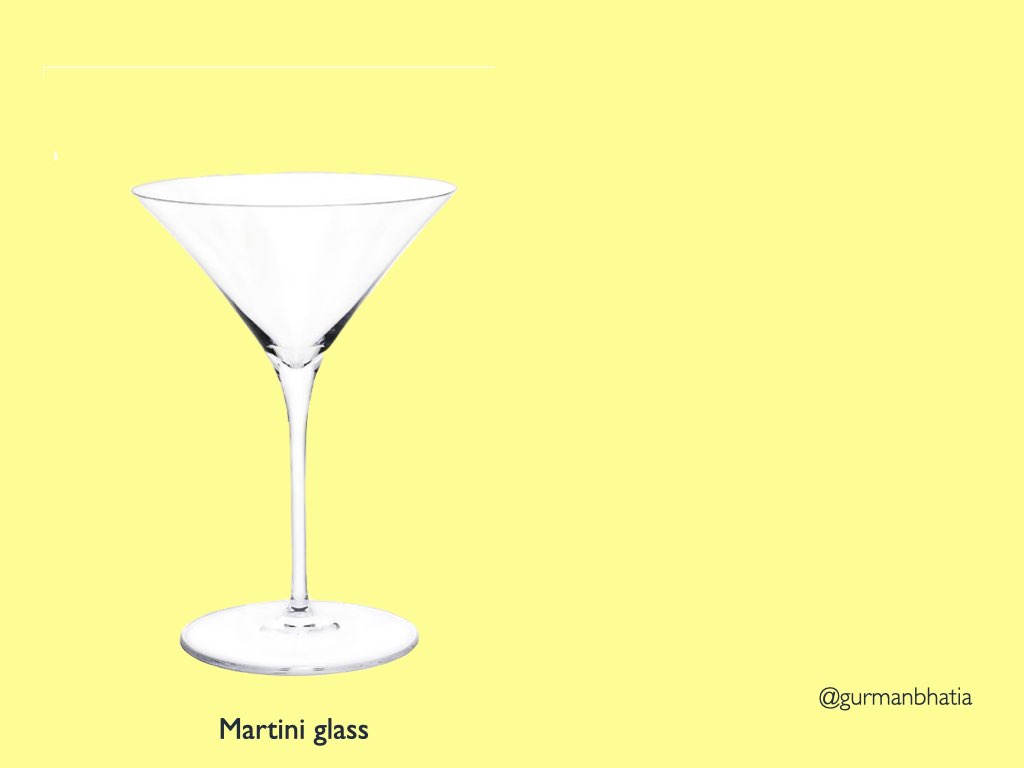
The Martini glass structure starts with the inverted pyramid and follows it up with chronological events and a strong ending.
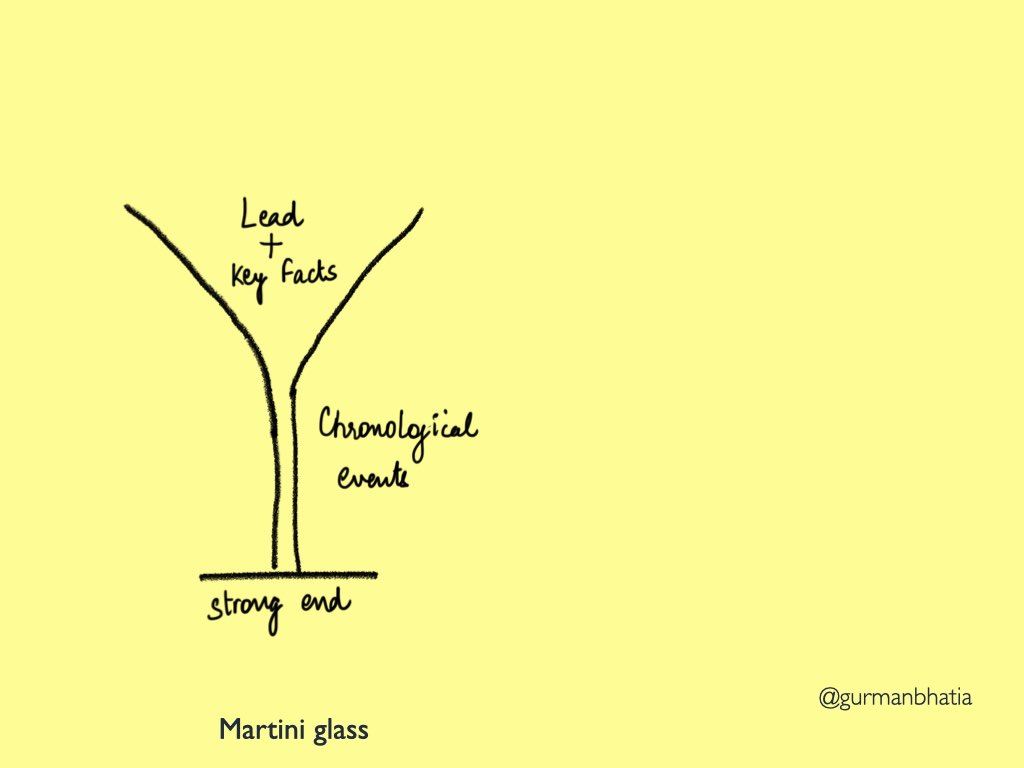
To illustrate this, I am going to talk about this piece about the events of the tractor rally in Delhi on January 26, 2021.
The piece starts with the key facts and then tells a straight up chronology of what happened using photos, maps and words.
But towards the end, you have this uber long line of tractors to show the scale of lining up 7,000 tractors - a number the police said were present on one of the starting points. It is a strong visual ending.
Do you explain or help the reader explore? To answer that question, we spill our martini!

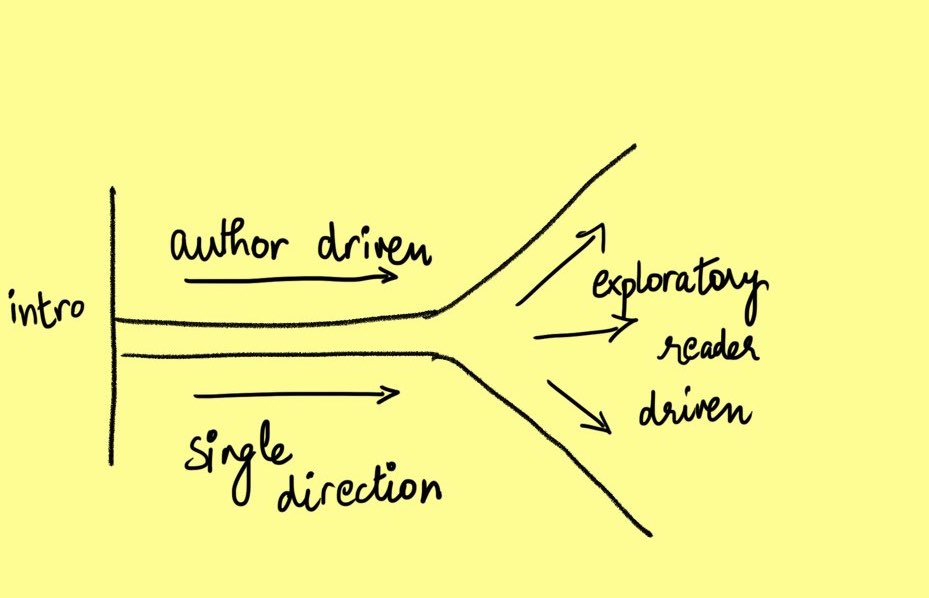
Often, one way to tackle the challenge is - explain and then let the reader explore.
In this story by my colleagues Manas Sharma and Simon Scarr, they start with explaining the science of herd immunity and the impact of factors such as social distancing and vaccination.
But towards the end, they let you play with the variables to simulate how they might effect the spread.
Similarly, in this story about access to different subjects for government schools in Delhi, I break down the problem as a user scrolls.
But in the end, I give you variables to play with and see them reflect on the map.
But dashboards are just exploratory and interactive… right?
Not necessarily!
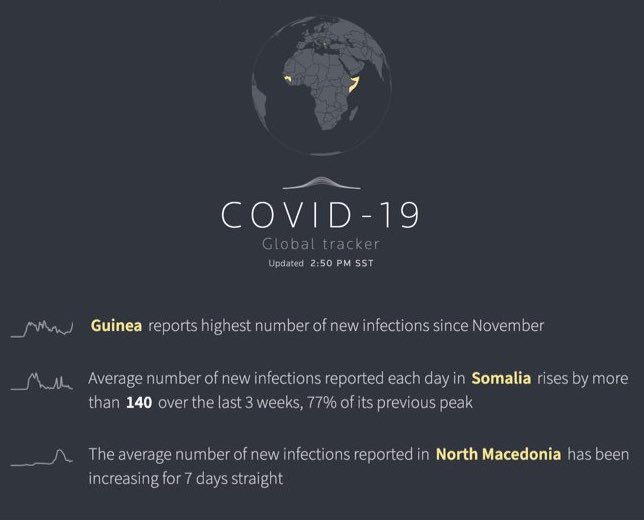
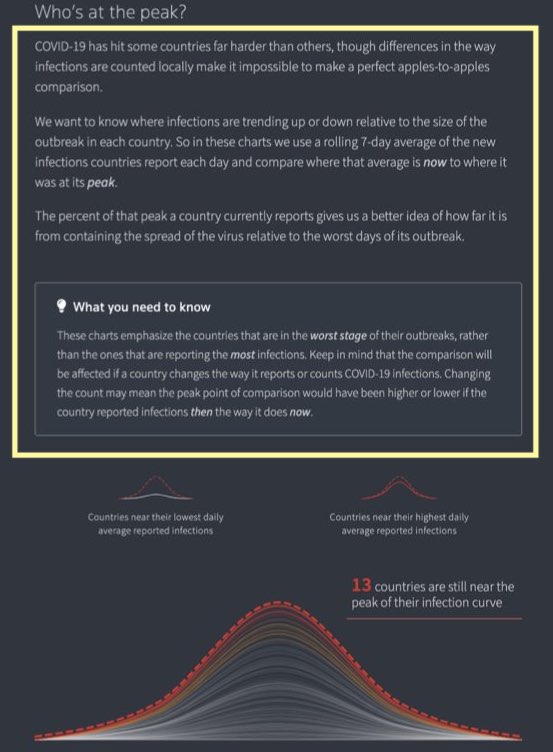
Dashboards can also be a mix of narrative and exploration. Take for instance, the Reuters COVID-19 dashboard. The beginning of the page is just a bunch of headlines about some interesting trends in the world.
But almost every explorable section is rife with “smart text” (see highlighted boxes), that changes based on the numbers and what they are saying.
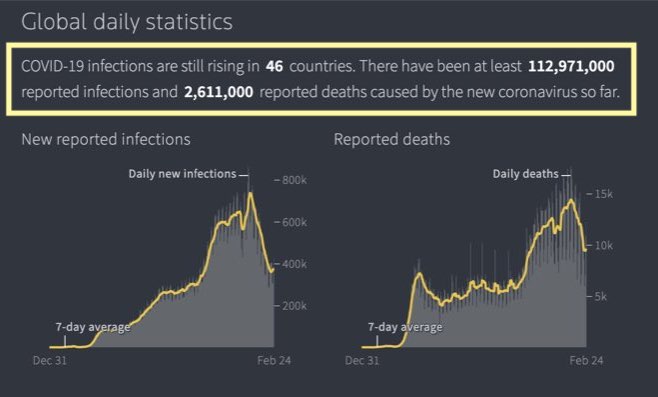
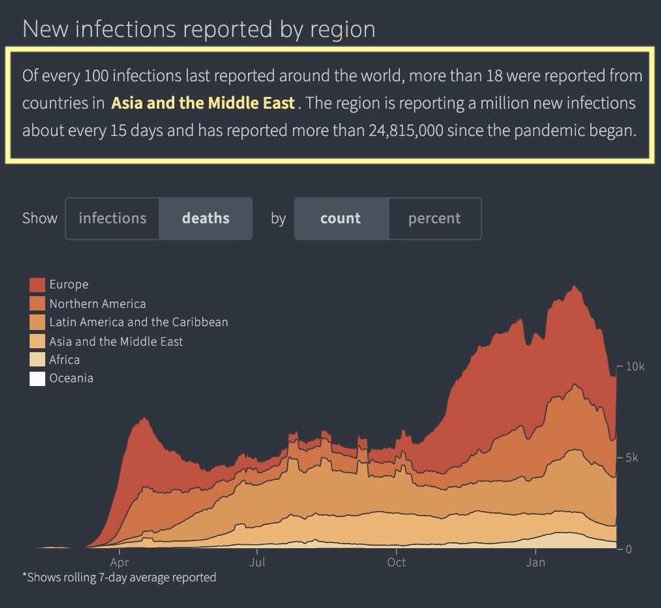
You will also see lots of explanations of what the data may or may not be able to tell us. Explaining limitations of your data, is another important aspect of communicating with dashboards.
The Diamond

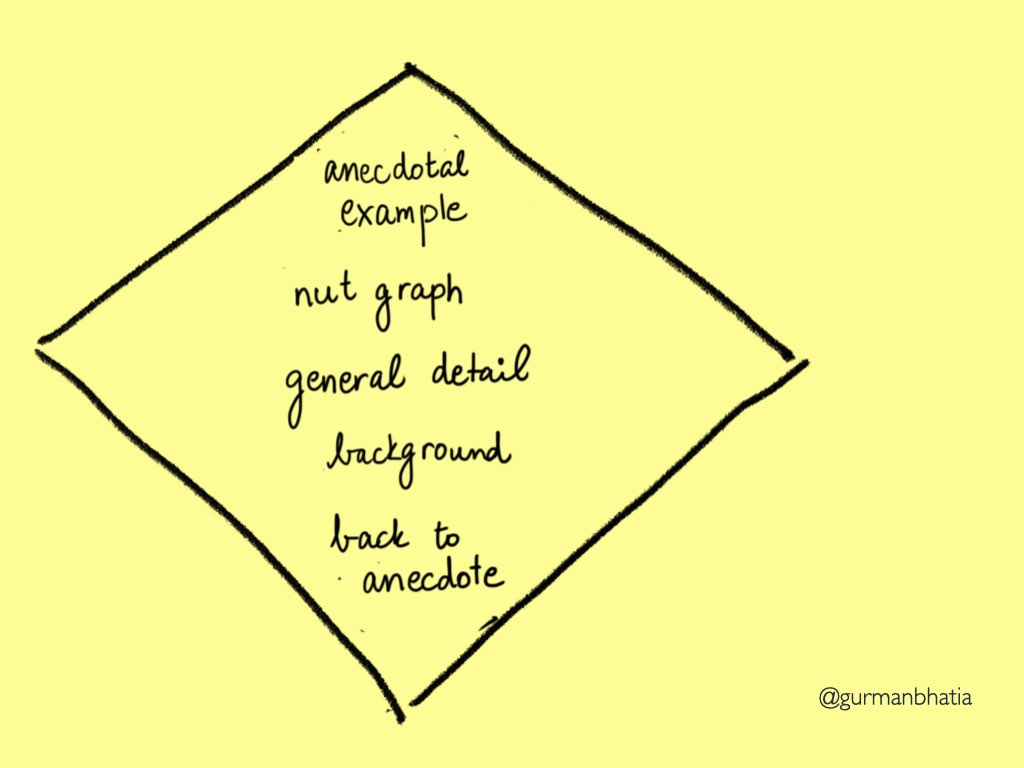
A lot of journalistic stories start with an anecdote. Take for instance, this Pulitzer Prize winning story. Anecdotes help the reader focus on one story, acting as a hook into the article. On the other hand, outlaying the facts right at the top can sometimes overwhelm the reader.
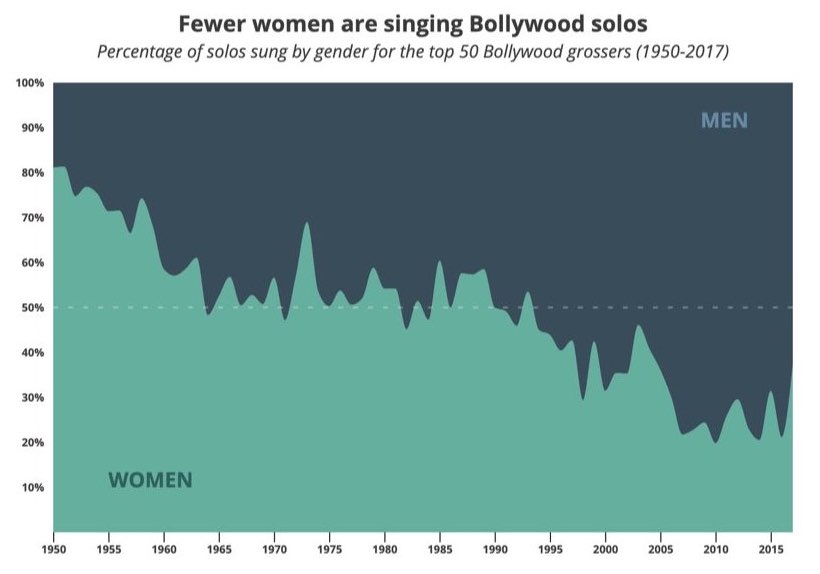
In this piece about the female solo diminishing from Bollywood songs, I start with a specific visual hook.
Solo songs sung by women in 2017 vis-a-vis solo songs sung by men.
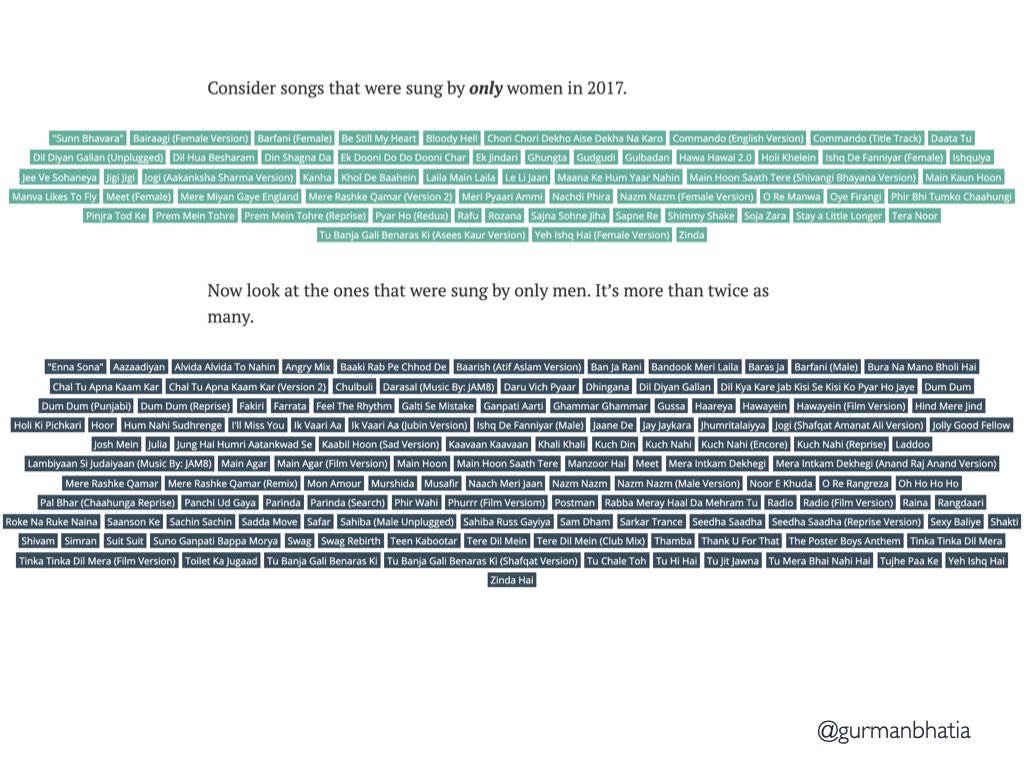
You see the nutgraph after that.
Bollywood music albums didn't always look like this. We analysed more than 24,000 Bollywood songs from the 50 highest-grossing movies of every year since 1950 and discovered that the share of songs being sung by women is constantly declining.
And a chart to bring that point home…
And then lots of context and background information to explain in detail what is happening.
Followed by an attempt to answer the question - “So what led to an explosion of songs that were sung only by men?”
Here is one of the many possible reasons…
Recently, Bollywood storylines have given more prominence to women. But that doesn't necessarily translate to more female songs because lip-sync is not as popular as it used to be. So even in female-centric films like Queen and Kahaani, there aren’t many songs sung by women.
And flows easily into another specific example…
Kahaani 2, the thriller from 2016 with a female protagonist, does not have a single female solo; contrast that with three solos sung by men. Yet there is also 2017’s Lipstick Under My Burkha, where every song is sung by only women.
Anecdotes are ways with which we zoom in to a data point. That storytelling technique is compelling because instead of overwhelming the reader with a lot of information, we present one data point. But that has a limitation of hiding the overall picture…
So… should one zoom in or zoom out?
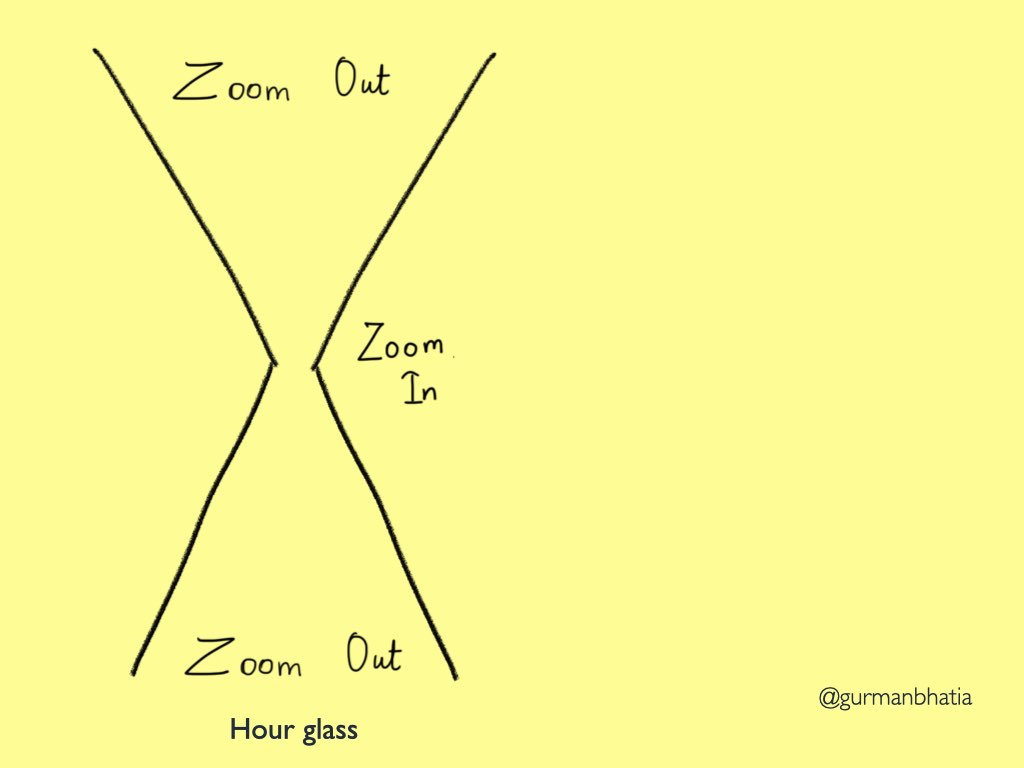
To answer that question, I present the hourglass!
Hour glass
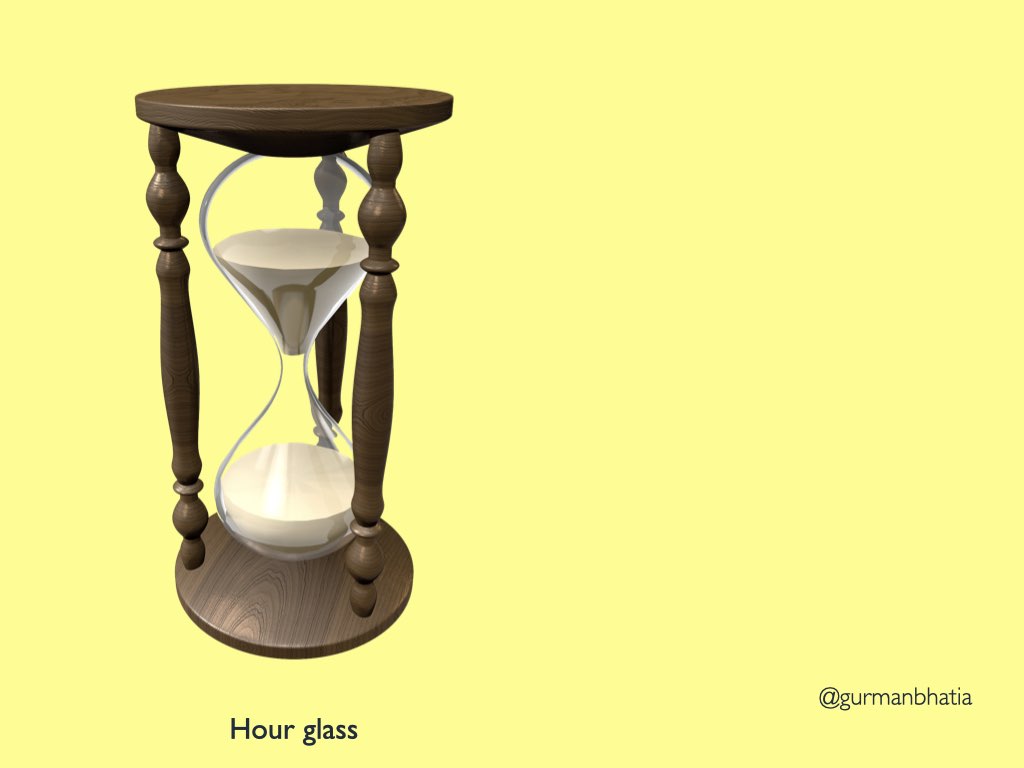
Here is a modified version of the original hourglass. Zoom out in the beginning, zoom in and then zoom out again.
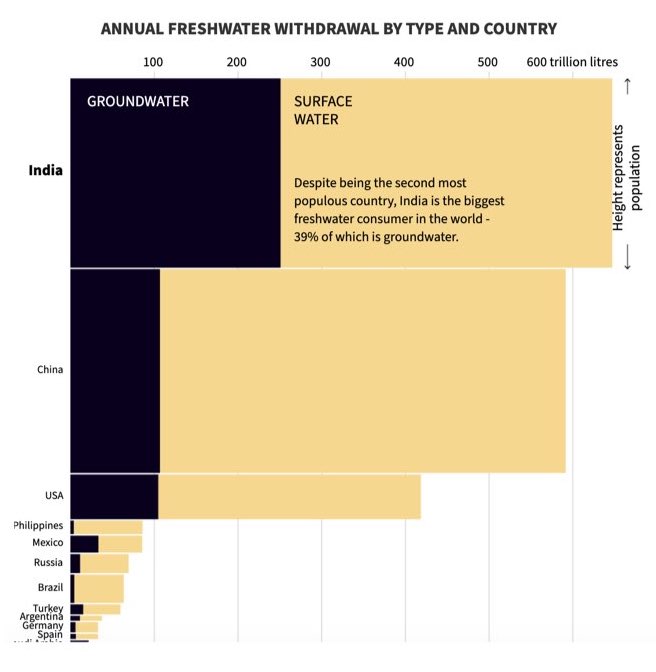
This story about groundwater in India starts with a globe to show you the global situation and why this story is important.
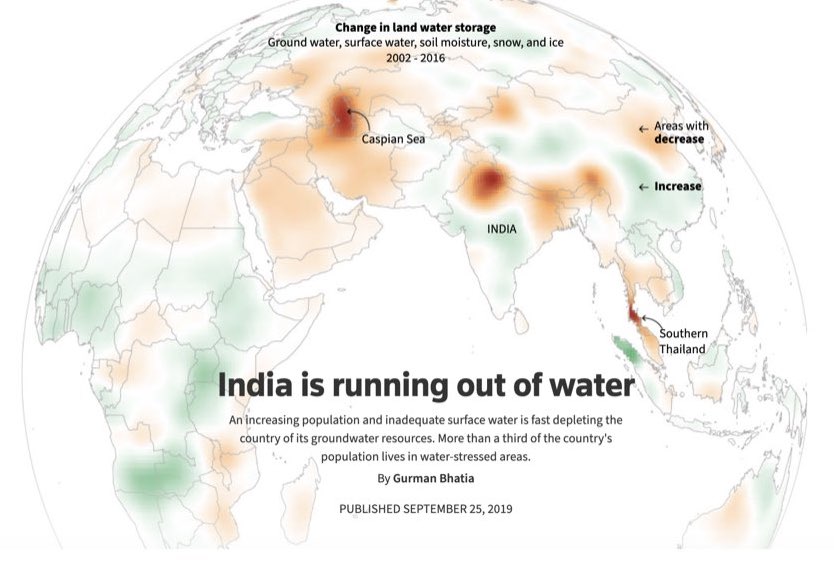
That’s followed by a zoomed in preview by district. You scroll to see what the best and worst performing districts are.
Then you zoom out to the state level.
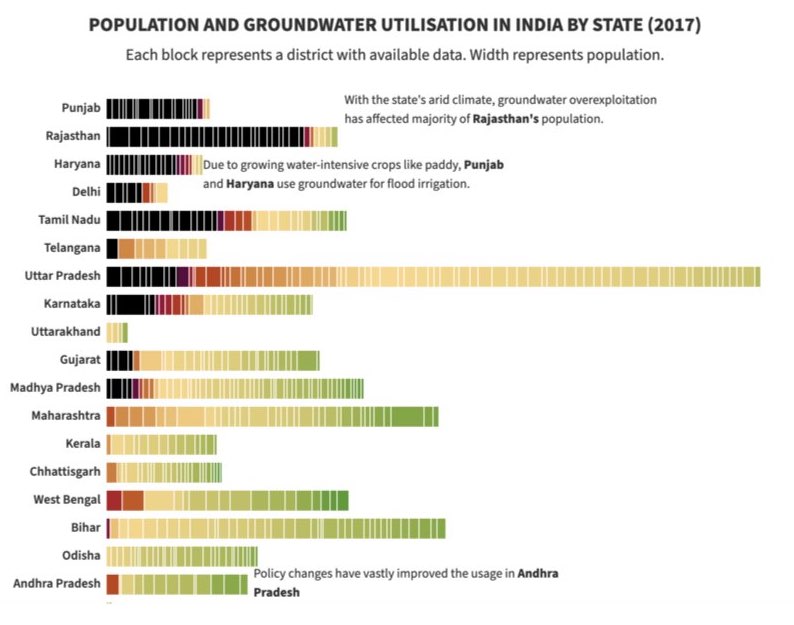
And ultimately back to the national level.
To summarise…
The whole shpeel breaks things down to four key decisions:
- The order of elements
- Explore or explain
- Visuals or words
- Zoom in or zoom out
And when optimised, those decisions can help you bring curiousity in the readers’ experience.
Four takeaways:
- Structure in a way to hook the reader in the beginning. Or to leave an impact in the end.
- Explain to pique their curiosity, and then let the reader explore to feed their curiosity.
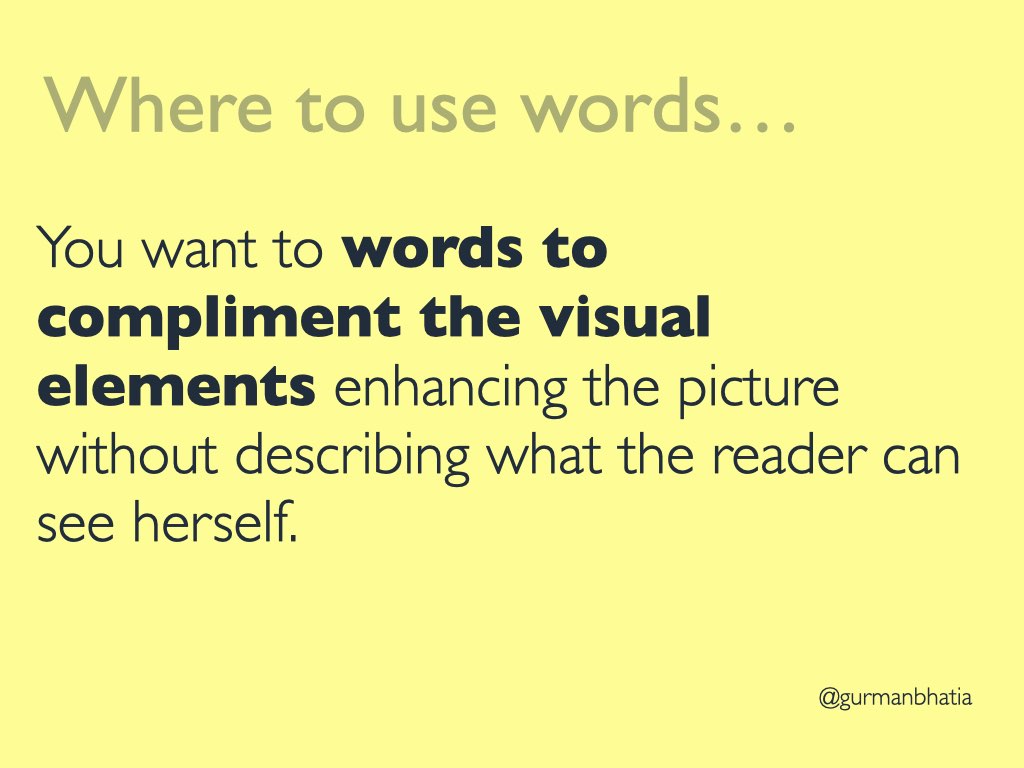
- Use words to compliment the visual elements
- Zoom out for the overview and context, but zoom in to satisfy the curiosity.