India Elections 2019 at Reuters Graphics
Originally posted as threads on X (thread 1, thread 2).
The Work
If you are trying to make sense of the India Elections 2019, I’d love to share some work that we’ve done at Reuters Graphics around one of the craziest elections in the world.
1) There are a lot of people in India. ECI deployed over 1 million polling stations to make sure no voter was more than 2 km away from one. Where are they? Which one was set up for one voter? Manas Sharma, Simon Scarr and Marco Hernandez bring you some beautiful maps.
2) A lot of people also mean a lot of candidates. 8,016 people contested in this year’s elections. We looked at their assets, criminal cases and age.
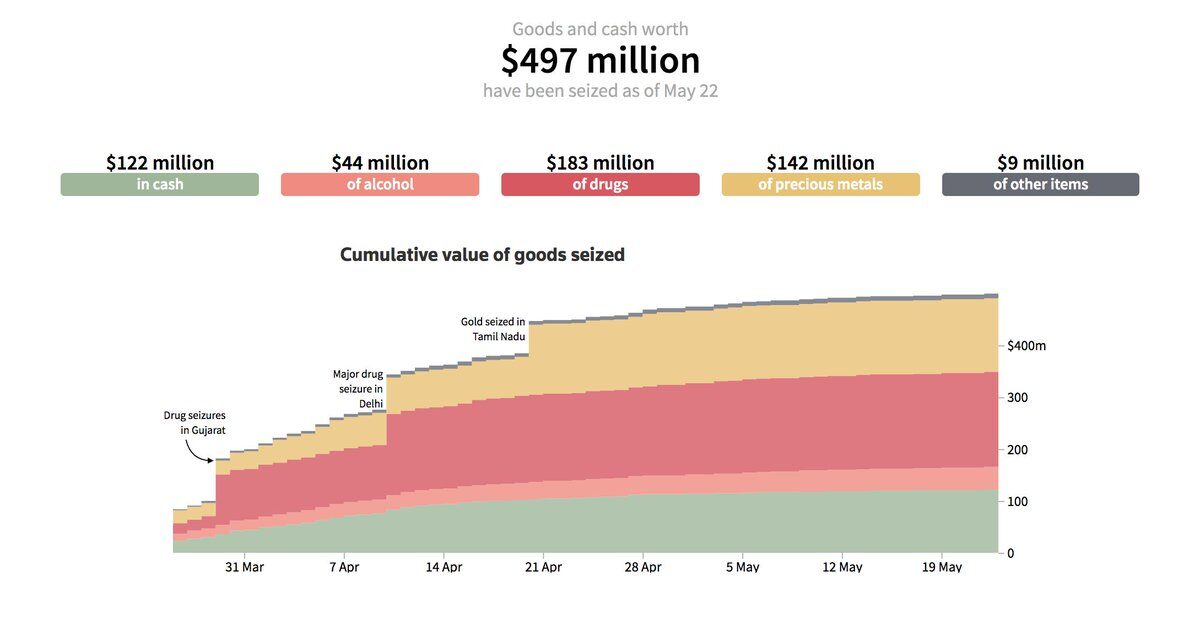
3) Drugs, gold, cash and alcohol worth $497 million have been seized in this elections so far. We tracked how that money has grown.
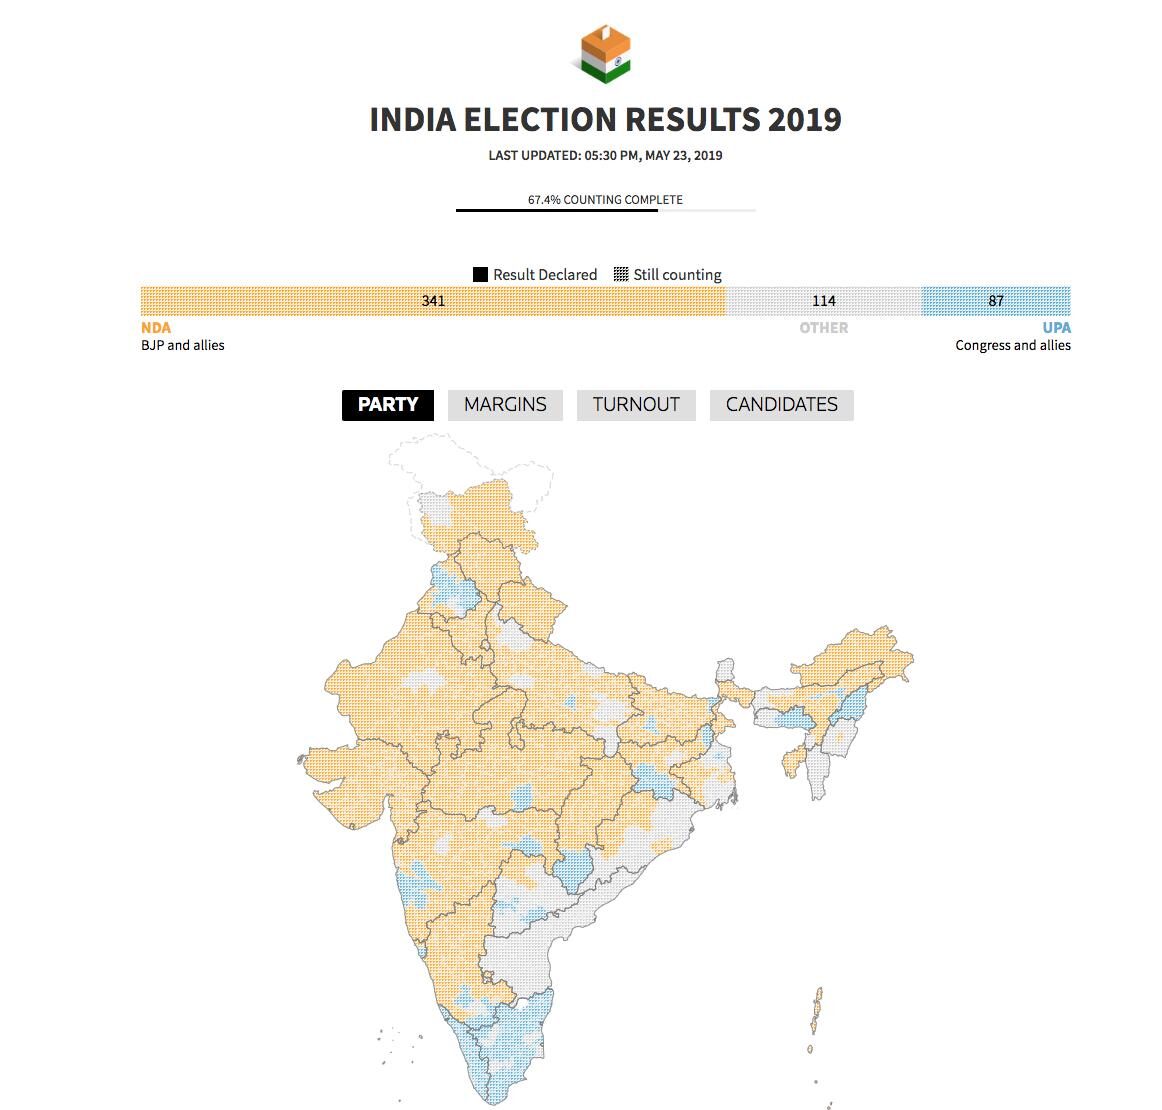
4) All election results in one place.
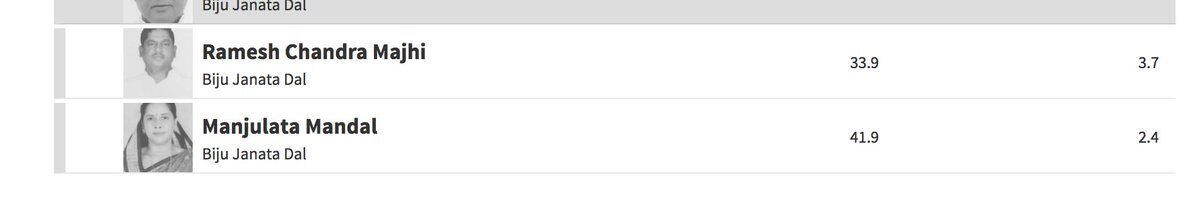
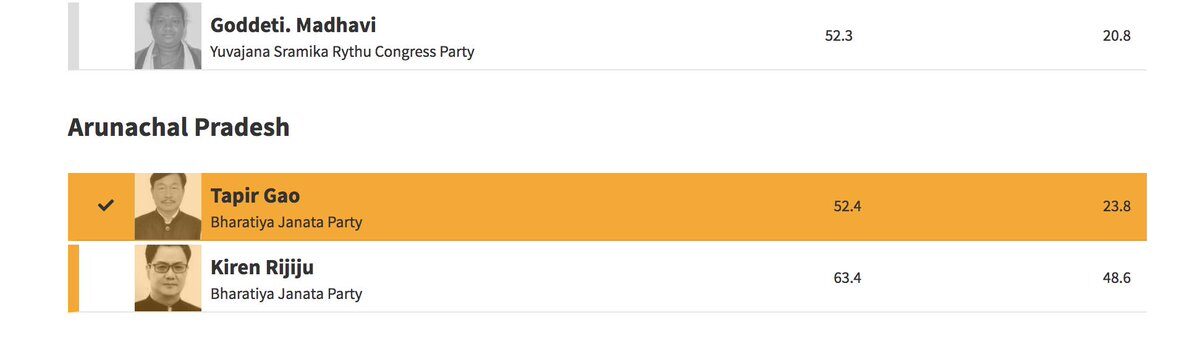
5) Line charts on how some races panned out on the day of results.
The Results Page
I have been fixing bugs and errors this morning. But now that I am finally done, here is a thread on some of the elements in our live election results!
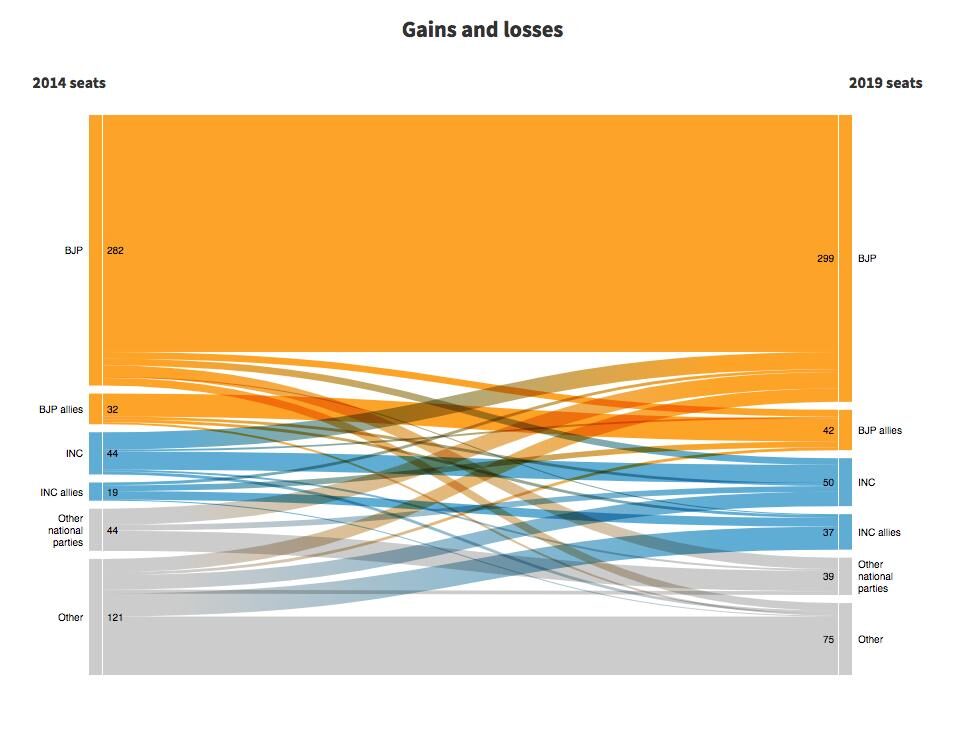
My most favourite bit is this sankey on the opening tab! You see where the seats have moved. Clearly BJP has retained a huge proportion of their seats.
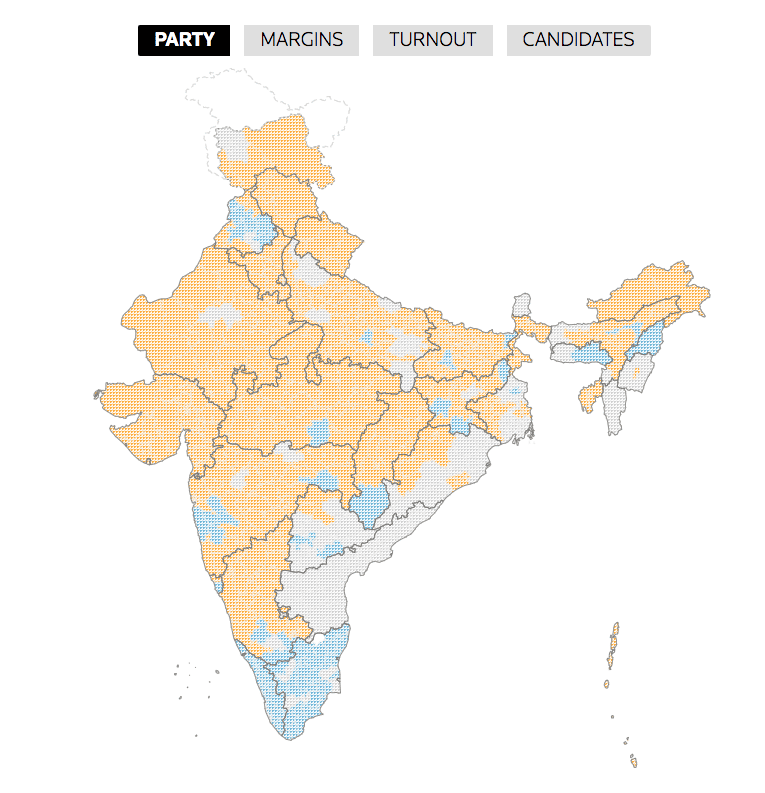
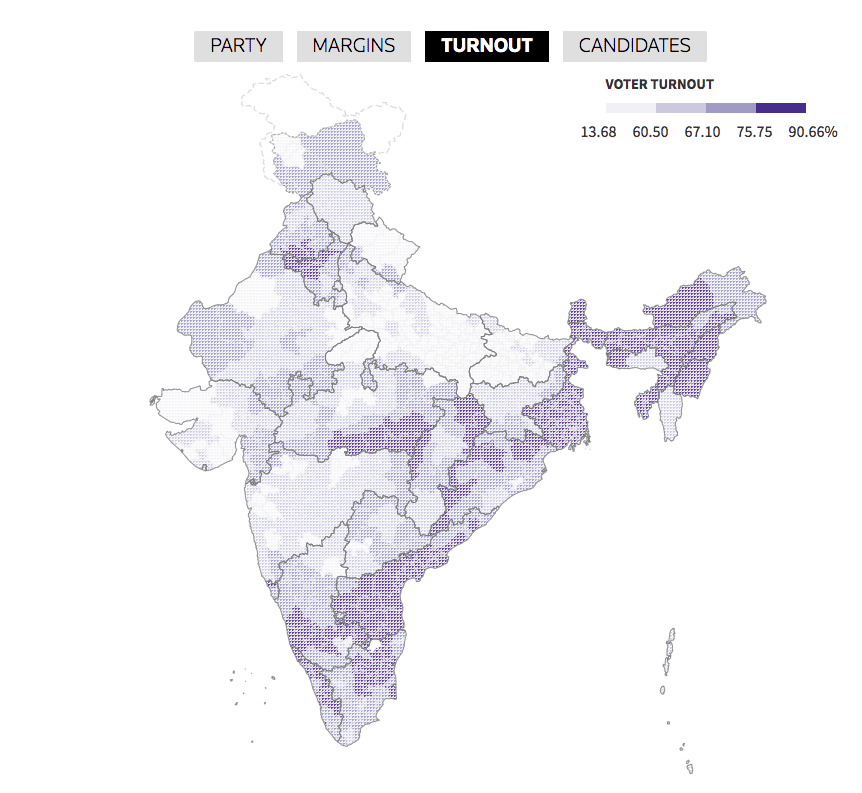
We let you toggle between margins, turnout and winning parties. Notice BJP’s high winning margins in Himachal, Uttarakhand and MP.
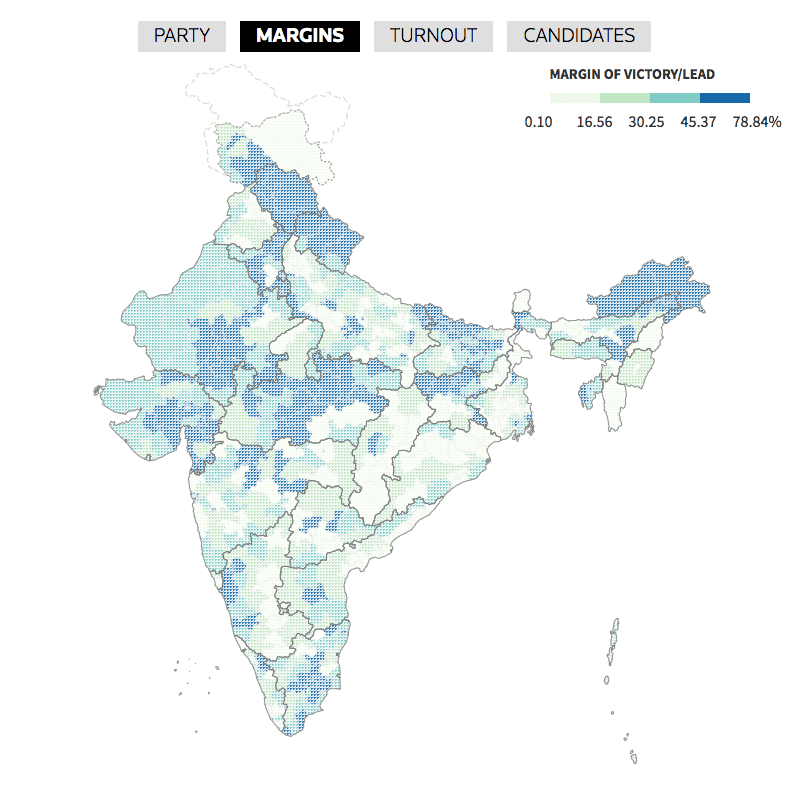
Lots of really wide victories at the moment!
In the candidates tab, go and explore some fun races going on right now.
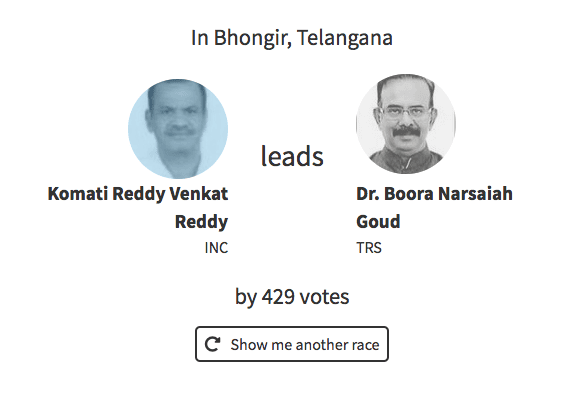
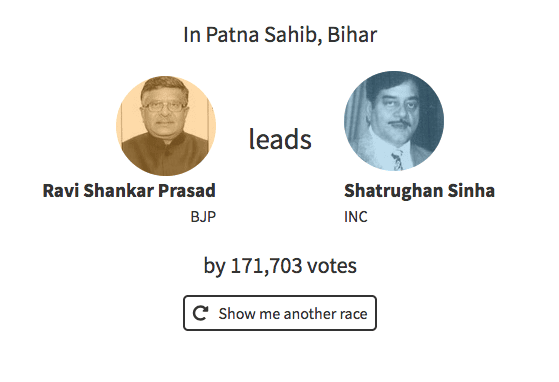
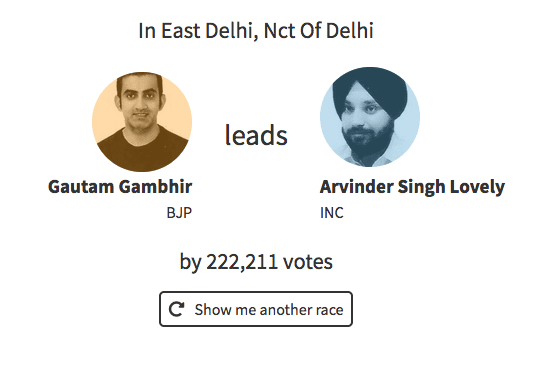
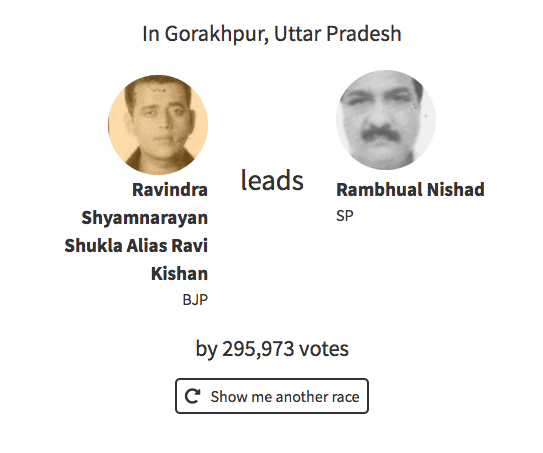
Orrrrr scroll through an entire list of leading candidates / winners.
We also added a handy counting percentage using the turnout numbers.
A small tooltip on hover vs a bigger, detailed tooltip on click.
Lots of seats declared. BJP in Karnataka, INC in Kerala.
Four seats are pending. 2 — really wide races. 2 — close margins.