Behind the Scenes of the Reuters COVID-19 Global Tracker
Originally posted as a thread on X.
The last 2.5 months have been full of crazy building, but at the end of it all, we are excited to present the brand new Reuters COVID-19 global tracker.
I want to share a quick recap of how we got here.
Sometime in January, Cate Cadell started collecting COVID-19 data. She had been creating sheets based on NHC reports, as well as coordinating with bureaus to get international numbers. Because she’d be in between reporting, sometimes I’d get figures in a message.
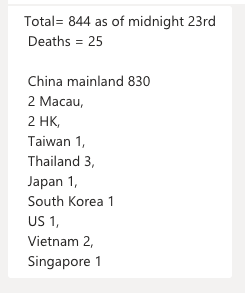
That would help me update a map like this everyday.
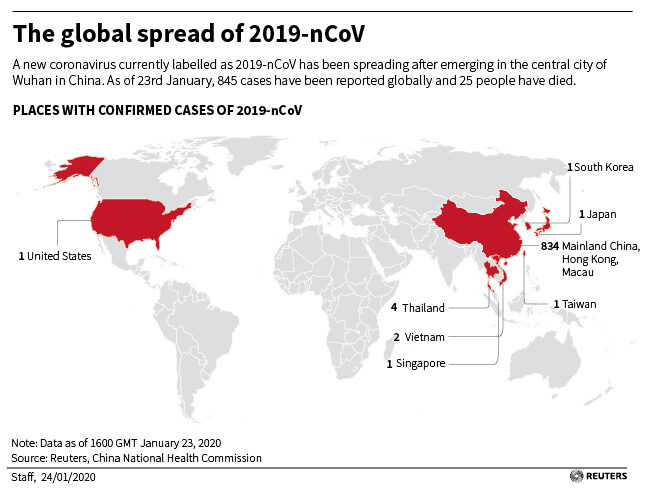
As the virus kept spreading globally, the story warranted an interactive. When we published the first iteration of a graphic that visualised the global spread, the byline on it looked like this.

Over time the story kept expanding and soon we had several people helping us with the data. Some of it came from national health ministry websites, some were collected by going to every state in a country and adding those up. By that time, our byline had grown into this.
There was a need to have something that could easily evolve with a fast-evolving story. Something that could take us from infections and deaths to testing and vaccination. And that is when Jon McClure took it up to build a new dashboard and pulled in Prasanta Kumar Dutta and me.
It is a feat to get bureaus to collect and verify numbers, hold daily calls across time zones to discuss tasks, and get translators to help us reach more readers. It’s also a feat few newsrooms can achieve. It only works because Reuters has bureaus around the world.
Our goal is to focus on new metrics — the second waves and the peaks. We wrote algorithms to analyse statistics so we could explain things to you in words in addition to charts and maps.
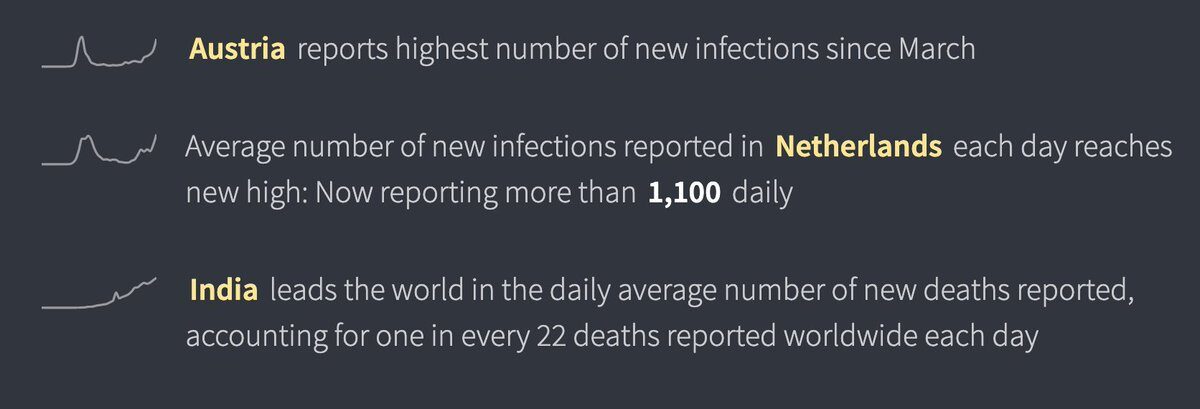
We want to provide a space that tells readers not only what the stats are, but what they can and cannot tell us. Something that could help identify hotspots, at the same time put outbreaks in context. This is just a start. We plan on adding more data points in the future.
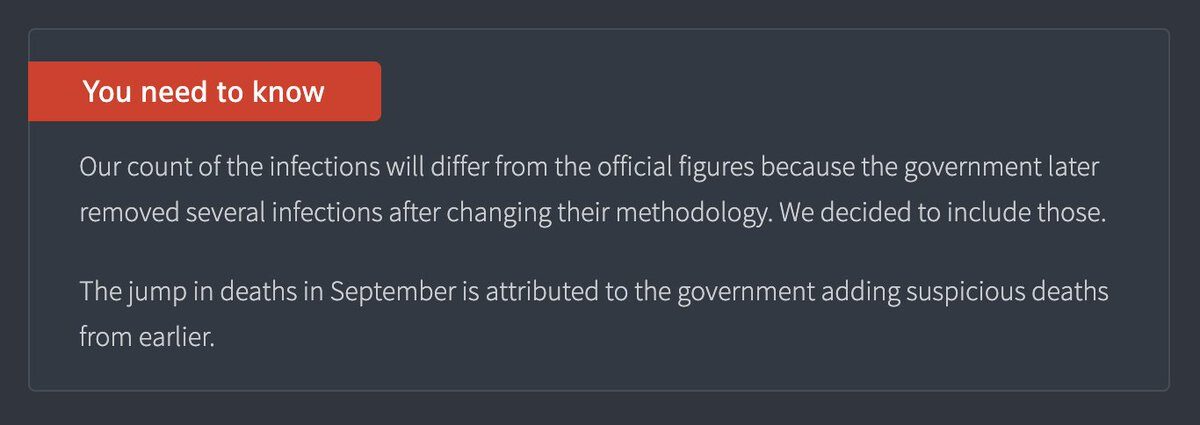
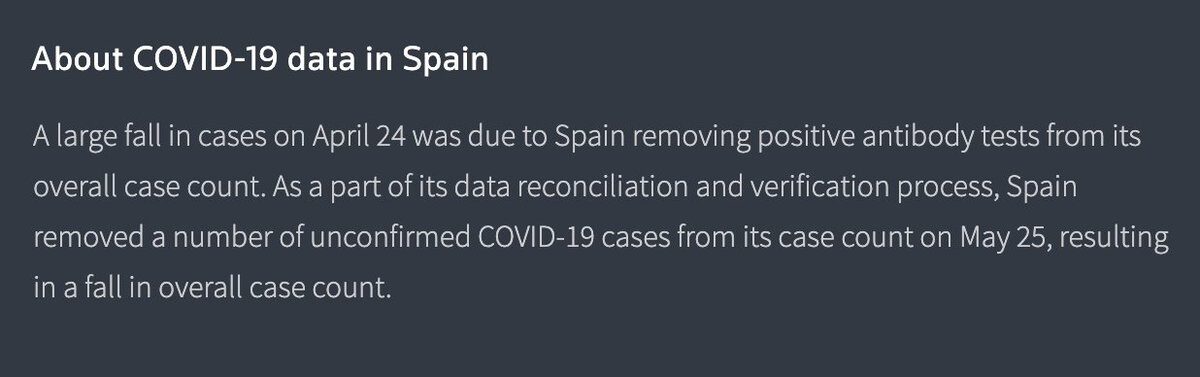
All this data is super tricky. Countries report inconsistently and their methodologies change all the time! We also want to flag when a data point is questionable, there are data dumps or consistent issues with a country’s reporting.
We have also tried to be completely transparent about where we get our data from. If you want to know more about how we collect COVID-19 data (and all the places we get it from) please check our methodology.
See how the world or a region is faring amidst a pandemic. Come for the charts and maps, stay for the auto-generated analysis.