The Life Cycle of Statistics
Originally posted on LinkedIn.
From Numbers in India’s Periphery: The Political Economy of Government Statistics — this diagram stopped me in my tracks.
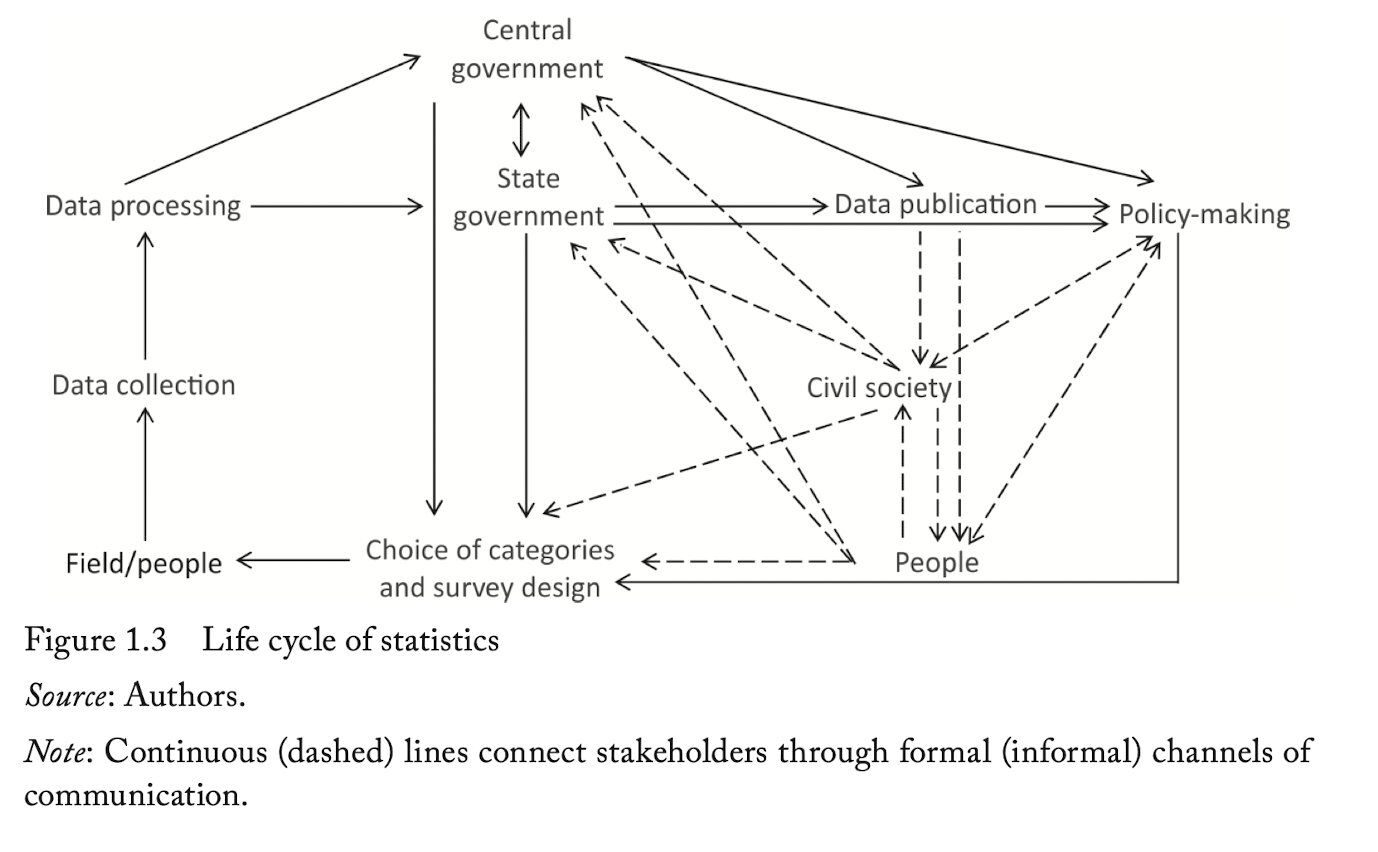 Figure 1.3 from the book — the life cycle of statistics, showing how formal and informal channels connect every stakeholder from the field to policy-making.